When studying statistics or machine learning, you often encounter the term variance. But what exactly does it mean, and why is it important? In this post, we'll break it down in simple terms and explore its significance in data analysis and machine learning.
Understanding Variance
Variance is a measure of how much a set of numbers deviates from their mean (average). In simpler terms, it tells us how spread out the values in a dataset are.
Imagine you have test scores of five students:
85, 90, 95, 100, 105
If the scores were all the same, there would be no variance. However, since they differ, we can calculate variance to measure this spread.
The formula for variance (σ²) is:

where:
- N = number of data points
- xᵢ = each individual data point
- μ = mean (average) of the data
Step-by-Step Example
Let’s calculate the variance of our test scores:
- Find the mean (μ):

- Calculate each deviation from the mean and square it:
- Find the average of these squared differences:
So, the variance of this dataset is 50.
Why is Variance Important?
1. In Statistics
Variance helps describe data distribution. A low variance means the data points are close to the mean, while a high variance means they are spread out. This is useful in analyzing trends and making predictions.
2. In Machine Learning
In machine learning, variance is critical when evaluating model performance:
- High variance: The model is too sensitive to training data and may not generalize well (overfitting).
- Low variance: The model is too simple and may fail to capture important patterns (underfitting).
Variance vs. Standard Deviation
Variance is often compared to standard deviation (σ), which is simply the square root of variance:
Standard deviation is useful because it is in the same units as the original data, making it easier to interpret.
Conclusion
Variance is a fundamental concept in statistics and machine learning. It helps us understand data distribution and plays a crucial role in model evaluation. Whether you're analyzing test scores or training AI models, understanding variance will improve your data interpretation skills!
Reference
'프로그래밍 > 수학' 카테고리의 다른 글
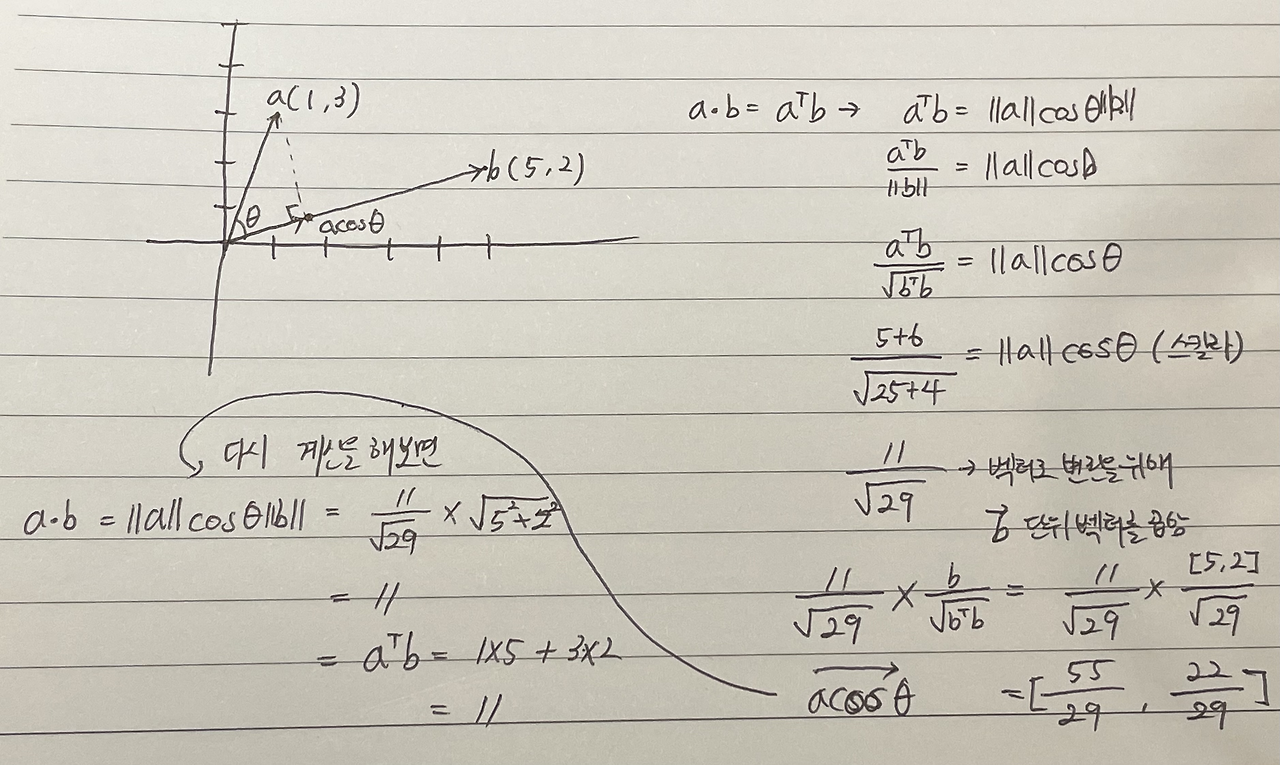
| Understanding the Dot Product: A Simple Explanation (0) | 2025.03.19 |
|---|---|
| What is a Vertex Cover? (0) | 2025.03.18 |
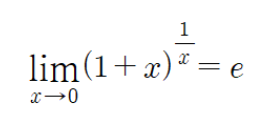
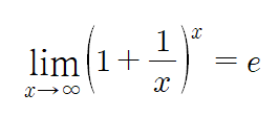
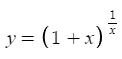
| What is the Natural Constant e (Exponential)? (0) | 2025.03.15 |
| Hungarian Algorithm: What Is It? (0) | 2025.03.12 |
| Likelihood와 최대우도추정(MLE): 확률과 데이터의 관계 쉽게 이해하기 (1) | 2024.10.04 |