What Are Bonds?
A bond is essentially an “IOU” issued by governments, corporations, or financial institutions when they need to borrow money. When you buy a bond, you're lending money to the issuer in exchange for periodic interest payments and the return of your principal at maturity.
How Do Bonds Work?
- The issuer (government or company) sells bonds to raise funds.
- Investors buy bonds, effectively lending money to the issuer.
- The issuer pays interest (also called a coupon) at regular intervals.
- At the end of the term (maturity), the issuer repays the principal amount.
📌 Example:
- The government issues a 3-year bond with a 3% annual interest rate.
- You invest $1,000 in this bond.
- Each year, you receive $30 in interest (3% of $1,000).
- After 3 years, you get back your original $1,000 investment.
Types of Bonds
✅ Based on Issuer:
- Government Bonds: Issued by national governments (e.g., U.S. Treasury Bonds, Korean Government Bonds).
- Corporate Bonds: Issued by companies to fund operations or expansion.
- Municipal Bonds: Issued by local governments.
✅ Based on Interest Payment Structure:
- Coupon Bonds (Fixed-Rate Bonds): Pay regular interest (e.g., every 6 months).
- Zero-Coupon Bonds (Discount Bonds): Issued at a discount and pay full face value at maturity instead of periodic interest payments.
Key Features of Bonds
1️⃣ Lower Risk than Stocks → Bonds are generally considered safer investments than stocks, as they provide a fixed return.
2️⃣ Fixed Income → Investors receive regular interest payments, making bonds attractive for income-focused investors.
3️⃣ Affected by Interest Rates → Bond prices and interest rates move in opposite directions:
- If interest rates rise, existing bond prices fall (because new bonds offer higher yields).
- If interest rates fall, existing bond prices rise (because they offer better returns than new bonds).
💡 Key Takeaway: Bonds are a stable investment option, offering predictable income, but they are sensitive to interest rate changes. Understanding these basics can help you make smarter investment choices.
'국내주식' 카테고리의 다른 글
| 채권(bond)이란? (0) | 2025.03.25 |
|---|---|
| How to Identify Undervalued Stocks Using EPS and PER (0) | 2025.03.17 |
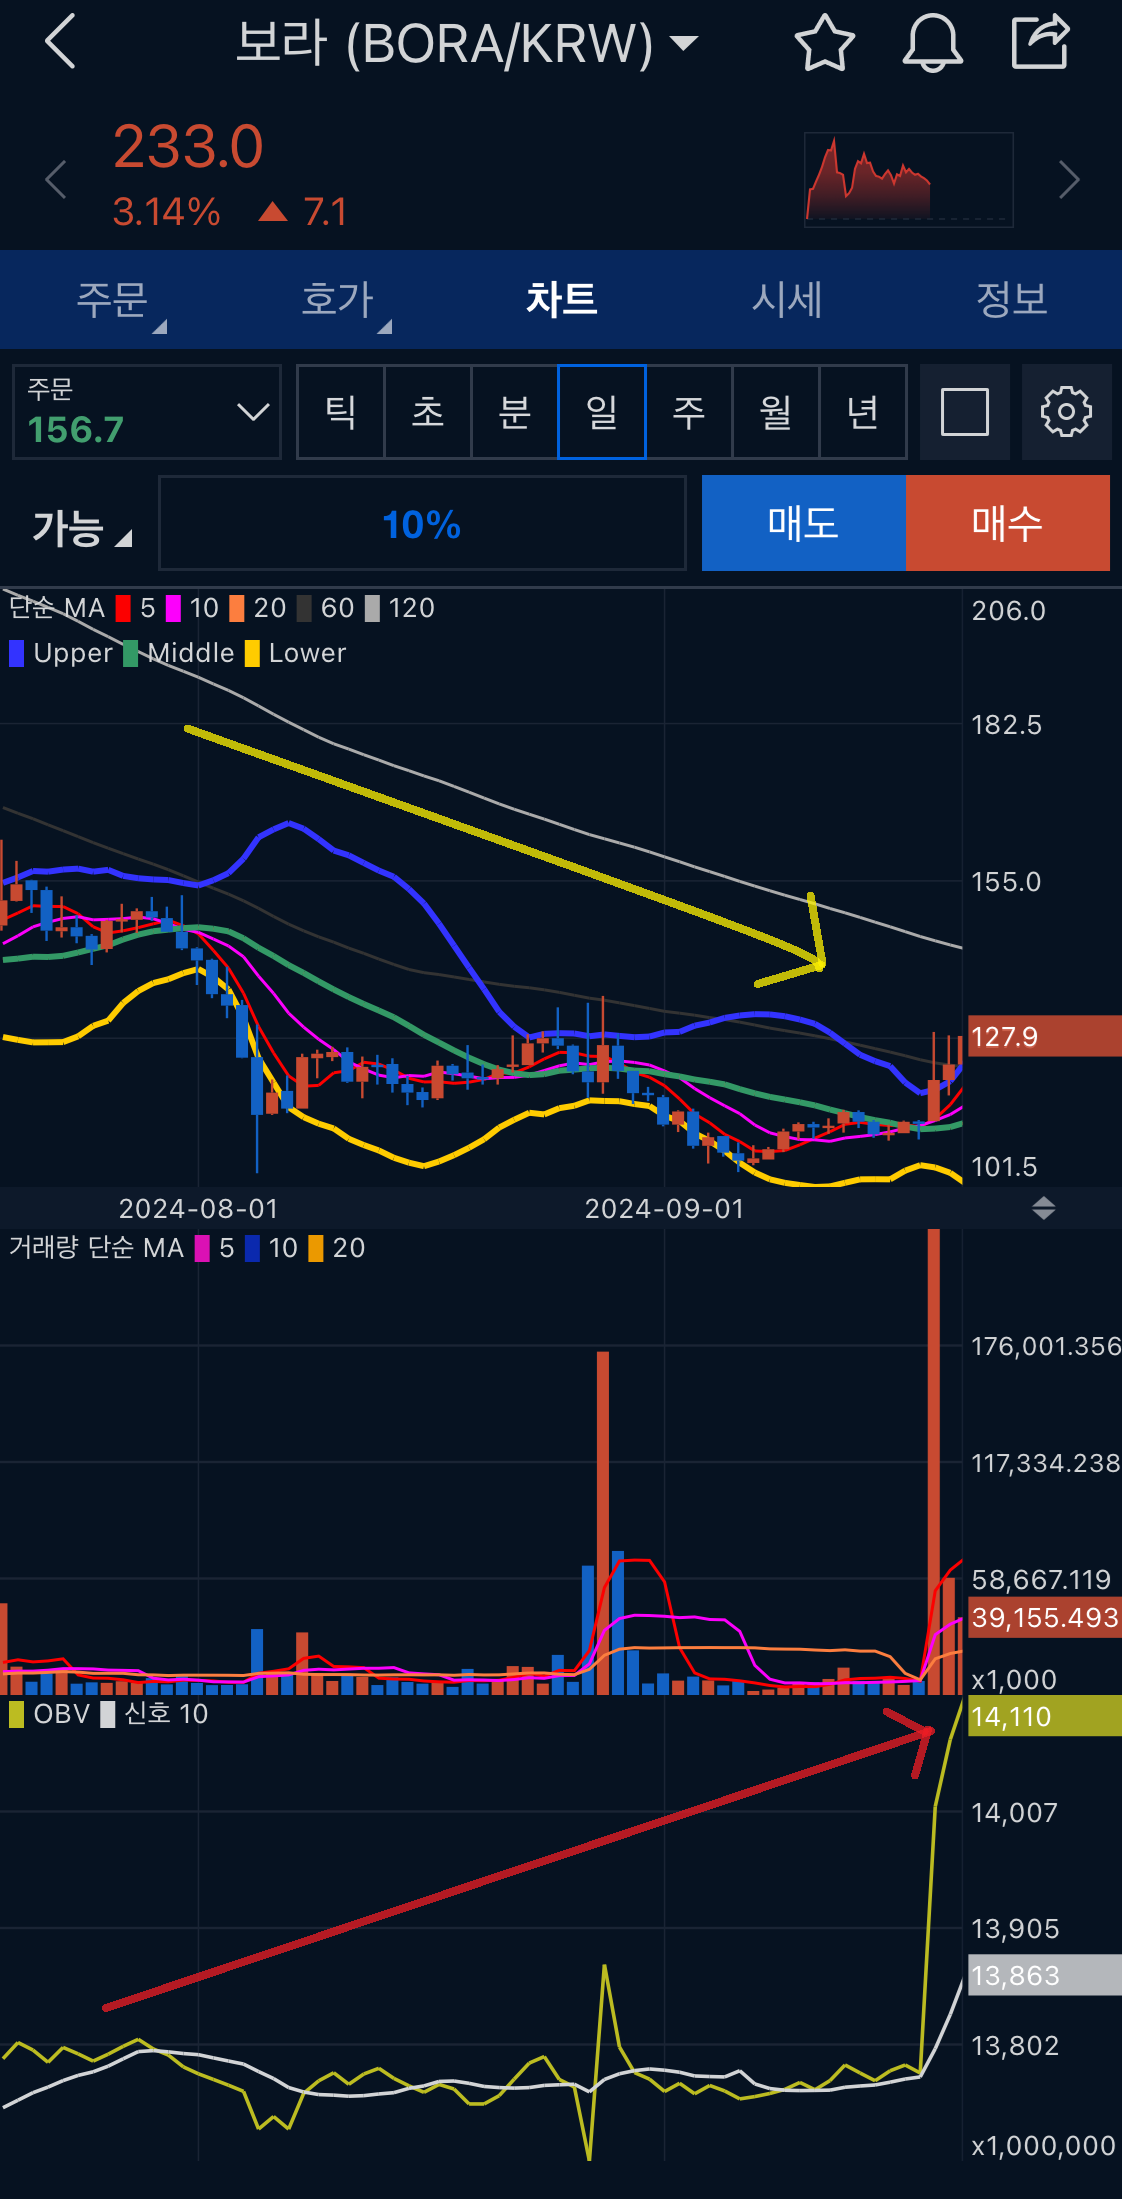
| What Is the OBV (On-Balance Volume) Indicator? (0) | 2025.03.14 |
| OBV (On-Balance Volume) 지표란? (1) | 2024.12.08 |
| HK이노엔 종목 분석: 성장 가능성과 투자 매력은? (1) | 2024.11.19 |